XPS module
The peakFit object
Note
Peak-fitting functions are hiding in the current release, but are not yet fully developed, tested or documented. The code snippet below conveys roughly how the process works at present. Look for this functionality in a future release.
#----  Create a model object
model = pesto.XPS.peakFit()

# Populate it with features
model.appendVoigtDoublet(amplitude=45e3,position=23.783,splitting=1.03,ratio=0.66,gauss_width=0.23,lorentz_width=0.21,label="C1")
model.appendVoigtDoublet(amplitude=39465,position=24.074,splitting=1.03,ratio=0.66,gauss_width=0.28,lorentz_width=0.21,label="C2")
model.appendVoigtDoublet(amplitude=20000,position=24.413,splitting=1.03,ratio=0.66,gauss_width=0.49,lorentz_width=0.21,label="C3")
model.append_BG_offset(offset=8000)
model.append_BG_shirley(shirleyfactor=0.001)

#---- configure some rules around how and whether parameters are allowed to change during the fit

# Don't allow the lorentzian width to change
model.getFeatureByLabel("C1").getParameterByLabel("lorentz_width").unlocked=False
model.getFeatureByLabel("C2").getParameterByLabel("lorentz_width").unlocked=False
model.getFeatureByLabel("C3").getParameterByLabel("lorentz_width").unlocked=False

# Don't allow the intensity ratio of the doublets to stray too far from the theoretical value
model.getFeatureByLabel("C1").getParameterByLabel('ratio').minimum=0.66 * 0.9
model.getFeatureByLabel("C1").getParameterByLabel('ratio').maximum=0.66 * 1.1
model.getFeatureByLabel("C2").getParameterByLabel('ratio').minimum=0.66 * 0.9
model.getFeatureByLabel("C2").getParameterByLabel('ratio').maximum=0.66 * 1.1
model.getFeatureByLabel("C3").getParameterByLabel('ratio').minimum=0.66 * 0.9
model.getFeatureByLabel("C3").getParameterByLabel('ratio').maximum=0.66 * 1.1

# Enforce that spin-orbit splitting can be varied, but it must always be the same for all three components
model.trackParameters(master=model.getFeatureByLabel("C1").getParameterByLabel("splitting"),slave=model.getFeatureByLabel("C2").getParameterByLabel("splitting"))
model.trackParameters(master=model.getFeatureByLabel("C1").getParameterByLabel("splitting"),slave=model.getFeatureByLabel("C3").getParameterByLabel("splitting"))

#----  Perform the fit to experimental data (x,y), and print the optimized parameters
model.doFit(x,y,beQuiet=False)

#----  Plot the fit and the component peaks
model.fitSummary(x,y)

Utility functions
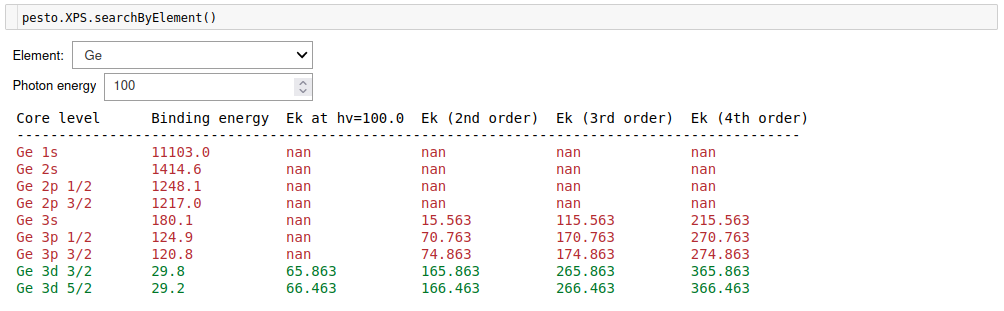
XPS.searchByElement
For a chosen element, display the binding energy and kinetic energy for all core levels. A red entry means that first-order light cannot excite it, but contamination from higher orders may still cause the feature to appear in your measurements. The database covers up to Bi and is based on data from webelements.com, which in turn references mostly Cardona and Ley, Photoemission in Solids I (1978)
def XPS.searchByElement()
Example:
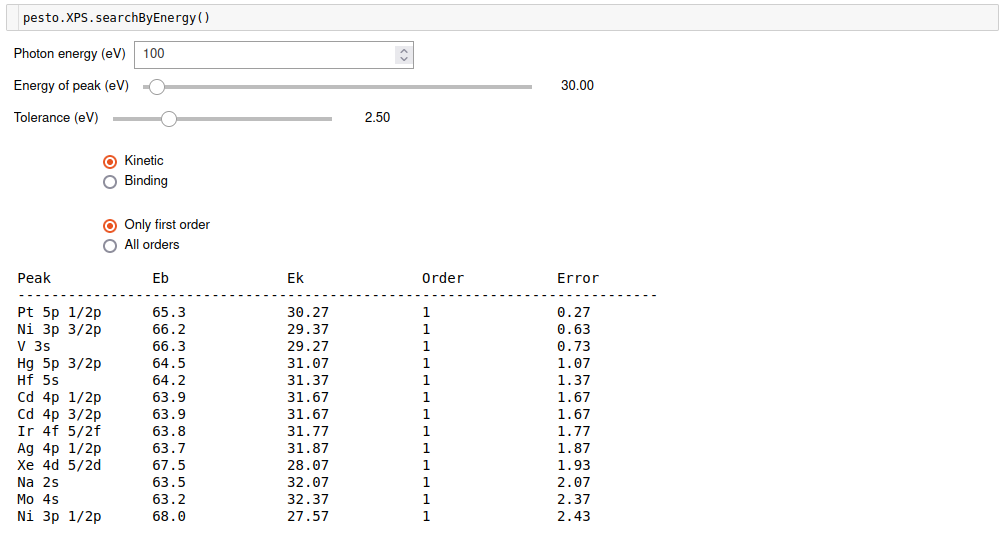
XPS.searchByEnergy
Sometimes you can have an unknown peak and you need to reverse-lookup what it could come from based on its kinetic or binding energy:
def XPS.searchByEnergy()
Example:
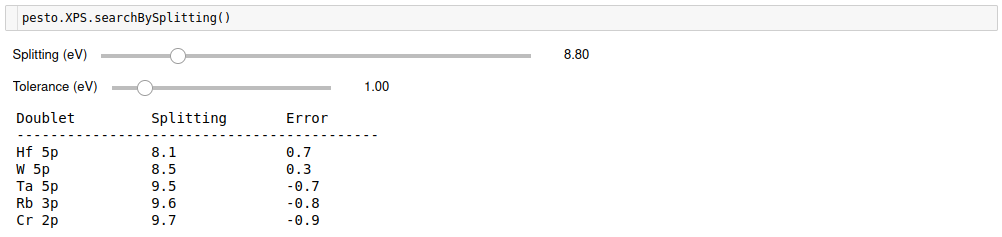
XPS.searchBySplitting
But since binding energies vary slightly depending on environment and/or the photon energy calibration might not be perfect, an alternative fingerprint if you have a multiplet is to look up candidates based on the spin-orbit splitting:
def XPS.searchBySplitting()
Example:
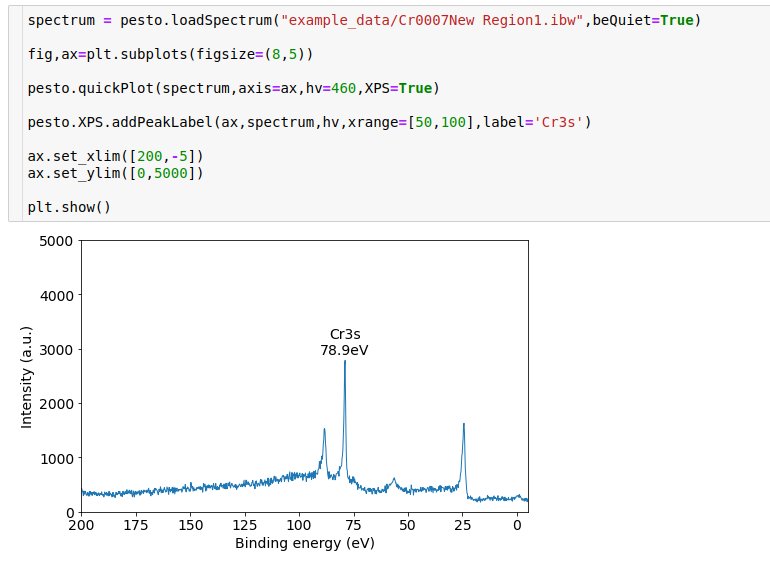
XPS.addPeakLabel
Now that you have hopefully identified all the peaks in your XPS spectrum, here is a helper function for labelling them.
def XPS.addPeakLabel( axis,
                      spectrum,
                      xrange,
                      hv,
                      label):
Required parameters
axis: The matplotlib axis object containing the XPS trace
spectrum: The XPS spectrum being plotted
xrange: Two-element list containing the start and end values of the subregion that will be searched for a peak
Optional parameters
hv: If ‘None’, will assume that you plotted the spectrum ‘as-is’ without modifying the energy axis. If non-zero AND the axis is called ‘Kinetic energy’, it will assume that you asked the plotting function to convert to binding energy, and it will do the same when searching for peaks. Default = None
label: String to label the peak with. Default = ‘’ (i.e. empty string)
- Returns:
Nothing (adds a label to an already-existing matplotlib plot)
Example: